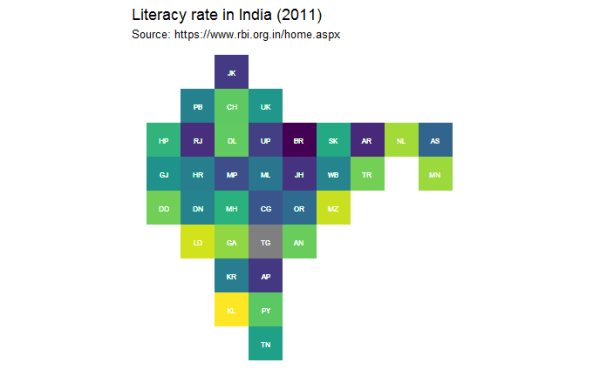
Learn to create a tile / grid map of India.
Tile / Grid Map of India – P1
Primarily visualizing data from census bureau of India and other cool stuff using R
Learn to create a tile / grid map of India.

The change in infant mortality rate in India, from 2014 to 2016.
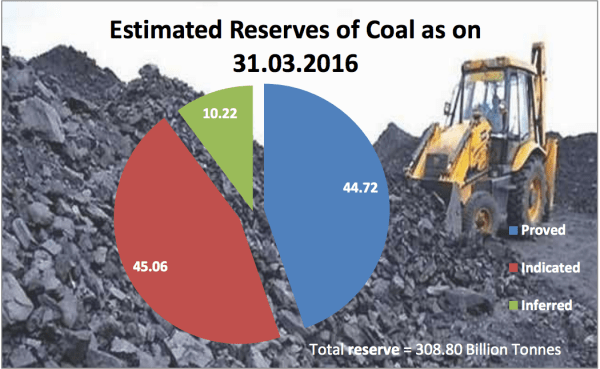
Here is how to fix a bad pie chart in R.
