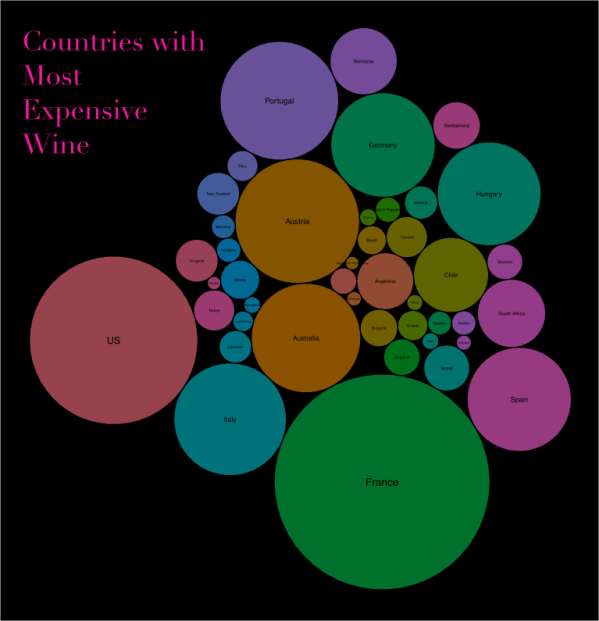
learn to visualize Wine data in R using packed circle visualization method
Primarily visualizing data from census bureau of India and other cool stuff using R
learn to visualize Wine data in R using packed circle visualization method
article lists free online resources to learn ggplot2 package and data visualization techniques.
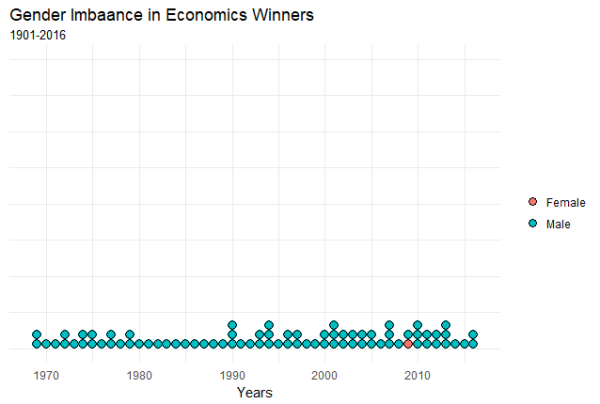
Post shows the gender bias in among Nobel Prize winners in the field of economics using the dot plot in R.
The population of India is projected to reach 1.39 billion by 2026. The important issue facing India is how to sustain this?
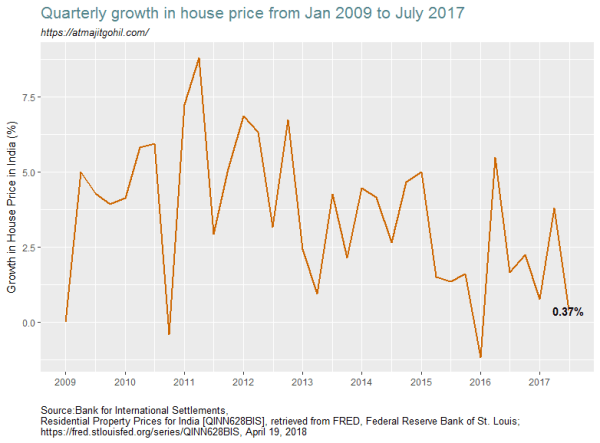
Understanding the trend in home prices in India from 2009 to 2017.

I visit various websites to collect data. Most of the sites i visit are mostly managed by various Government of India central or state departments / ministries. Given everything is digitized one realizes the extent to which this digitization has brought to light some of the issues related to quality of the websites as well... Continue Reading →

visualizing statewise murder cases in India from 2010 to 2016 using Geo Facet plot in R.
The National Crime Records Bureau (NCRB) in its yearly publication titled Accidental Deaths and Suicides in India reports 11 main causes of death in India from road accidents. The total deaths in India from road accidents is 148707. The top 4 causes of road accidents are dangerous/careless/ overtaking, speeding, other causes and weather. These 4... Continue Reading →

The change in infant mortality rate in India, from 2014 to 2016.
