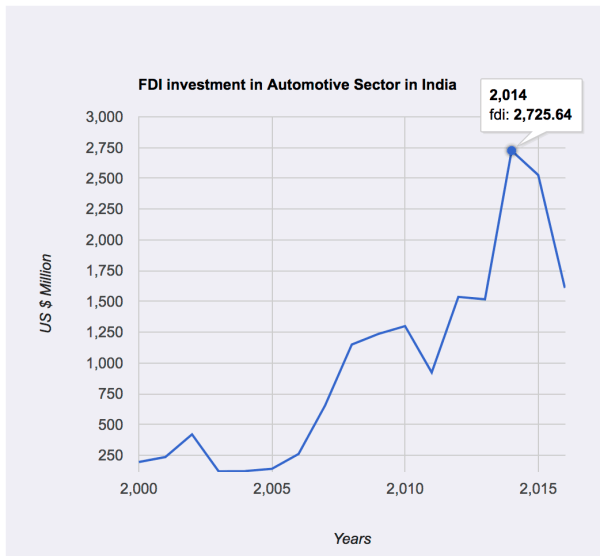
The post introduces generating line chart in R. Using the googleVis package allows us to generate interactive plot in R. The data used for generating the plot is based on FDI inflows in the auto industry.
Interactive Line Charts
Primarily visualizing data from census bureau of India and other cool stuff using R
The post introduces generating line chart in R. Using the googleVis package allows us to generate interactive plot in R. The data used for generating the plot is based on FDI inflows in the auto industry.
