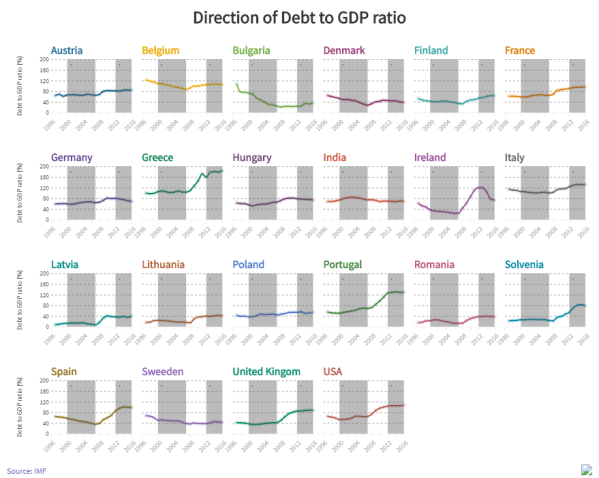
The article discusses the rising debt levels in european economies using animated bar plot and multiple line charts. The visuals are generated using flourish
Primarily visualizing data from census bureau of India and other cool stuff using R
The article discusses the rising debt levels in european economies using animated bar plot and multiple line charts. The visuals are generated using flourish
