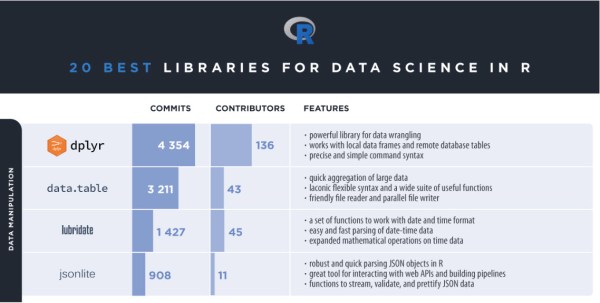
Post provides a list of top 20 R libraries in 2018 for data science.
Primarily visualizing data from census bureau of India and other cool stuff using R
Post provides a list of top 20 R libraries in 2018 for data science.
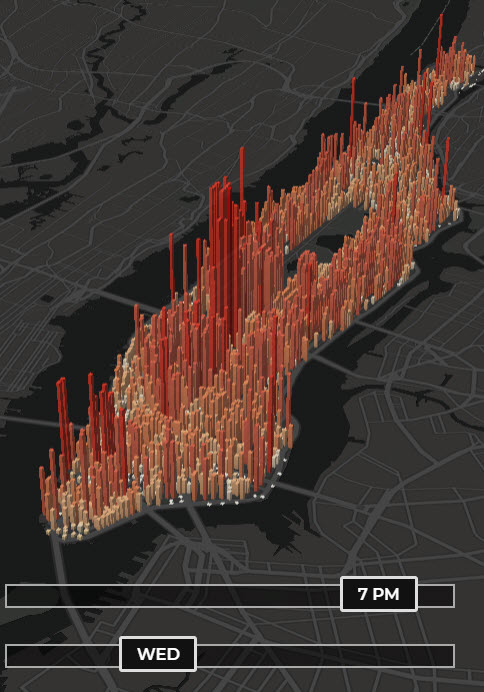
Visualization shows hour by hour change in the population of Manhattan.

The article provides an explanation on methodology to calculate comprehensive concentration index and entropy index using a user defined function in R.

NBER digest highlights the factors contributing to the stagnant wages in USA using HHI measure.
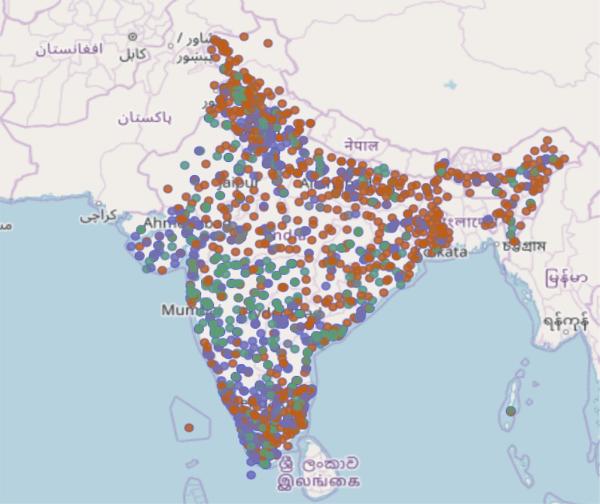
Locate the closest blood bank to you in India.
Understanding concentration measures such as Herfindahl-Hirschman Index (HHI) to analyze markets and horizontal mergers.
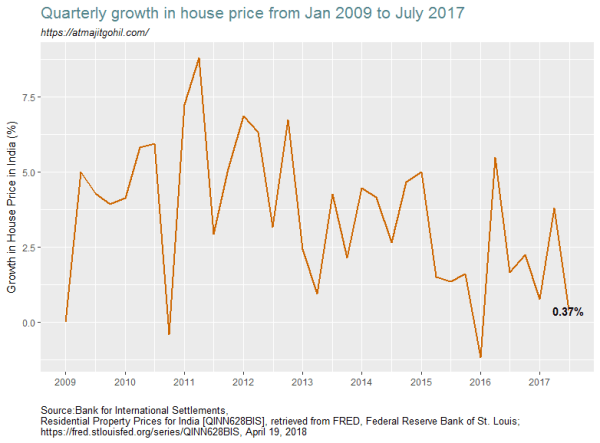
Understanding the trend in home prices in India from 2009 to 2017.

part II of Learn how to make a tile map of India.
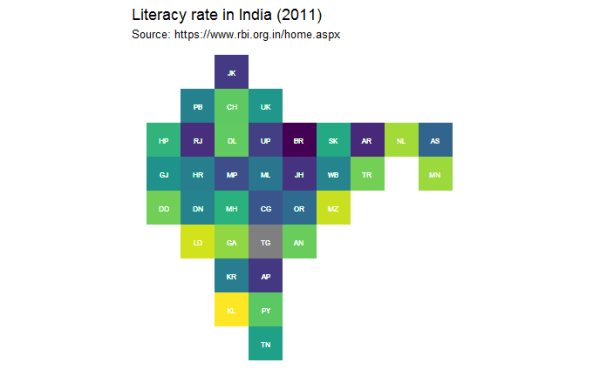
Learn to create a tile / grid map of India.

I visit various websites to collect data. Most of the sites i visit are mostly managed by various Government of India central or state departments / ministries. Given everything is digitized one realizes the extent to which this digitization has brought to light some of the issues related to quality of the websites as well... Continue Reading →
