A collection of Tidy Tuesday submissions made on twitter for wommen's soccer world cup 2019 made in R.

Primarily visualizing data from census bureau of India and other cool stuff using R
A collection of Tidy Tuesday submissions made on twitter for wommen's soccer world cup 2019 made in R.

This post contains all the visualizations generated in R using the #tidytuesday data set on UFO sightings.

Lear to create map in R using the ggplot2 package
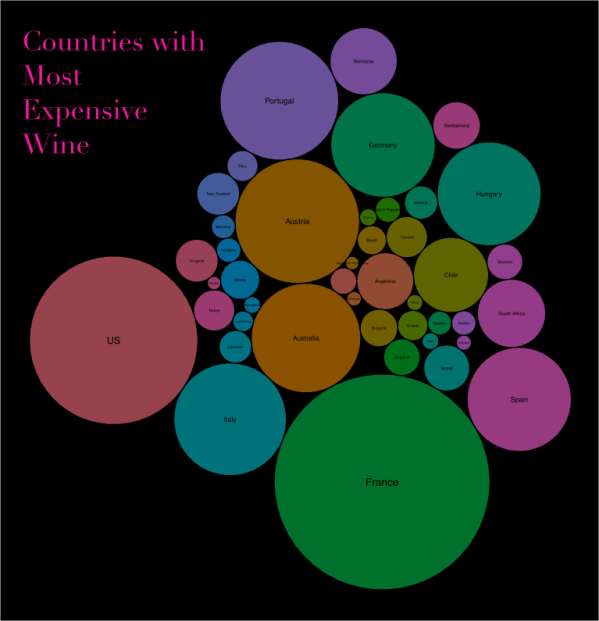
learn to visualize Wine data in R using packed circle visualization method
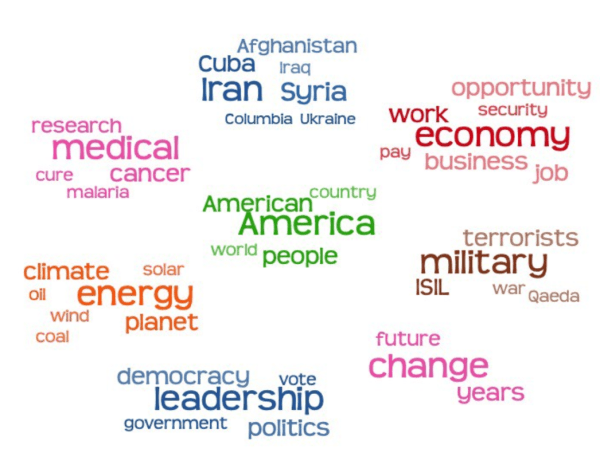
Article discusses the limitation of traditional word cloud visualization and how word cloud can be improved.

Article provides information such as code and Instgarma page links to art generated using Python.
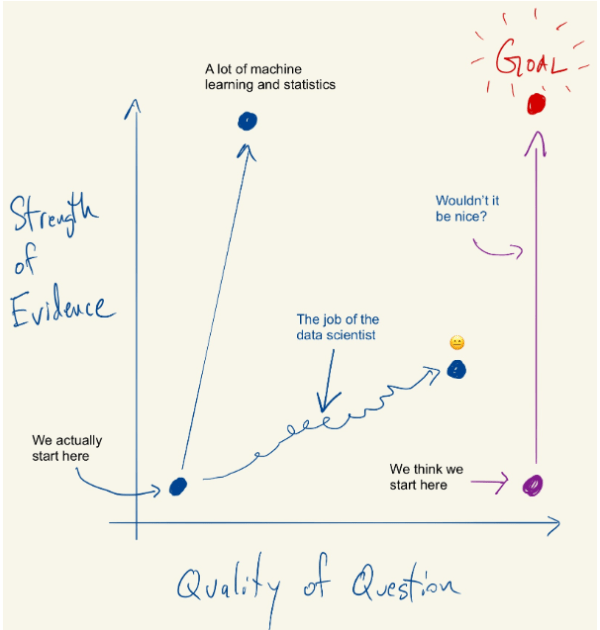
A blog post by Roger Peng explaining his views on design thinking.
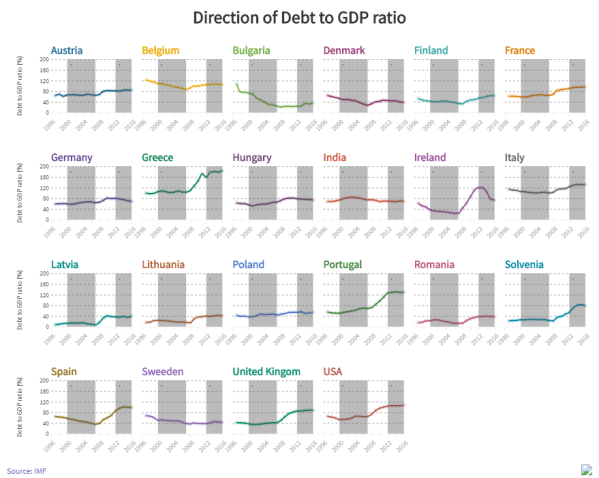
The article discusses the rising debt levels in european economies using animated bar plot and multiple line charts. The visuals are generated using flourish
article lists free online resources to learn ggplot2 package and data visualization techniques.
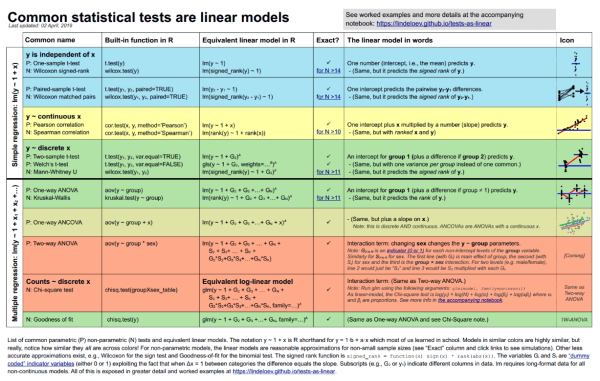
Articles provides R code and details on various statistical tests for linear models. A good summary for teaching linear models.
