Post discusses various types of normality tests and their functions in R.

Primarily visualizing data from census bureau of India and other cool stuff using R
Post discusses various types of normality tests and their functions in R.
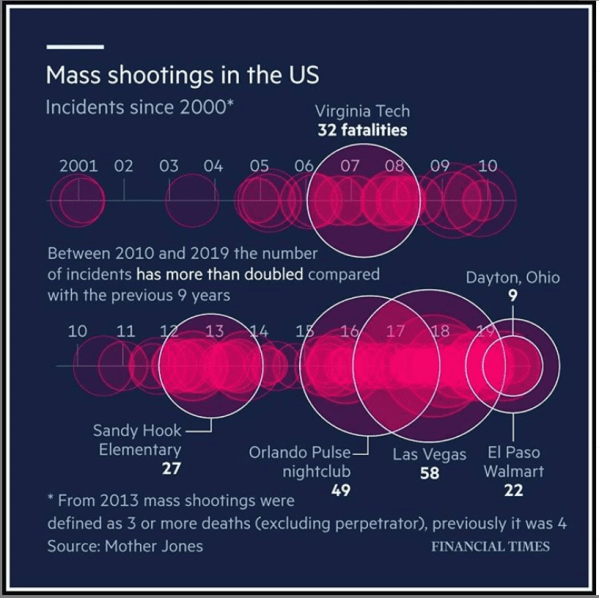
How many deaths occured in USA from Gun Violence since 2001.
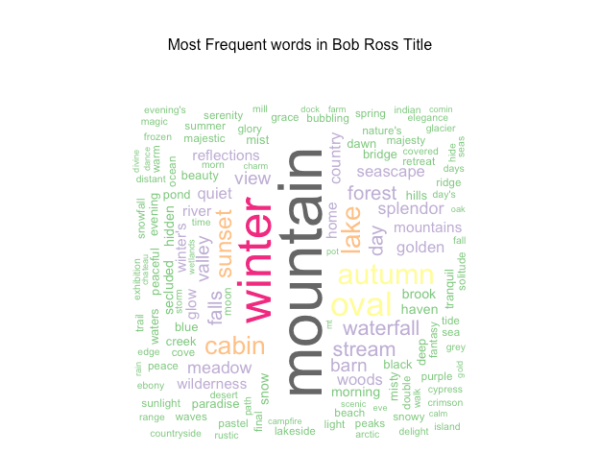
Learn to create wordcloud in R using the Bob Ross data provided as a part of Tidy Tuesday week 32.

Article provides a concise discussion of the most recent India Economic Survey.
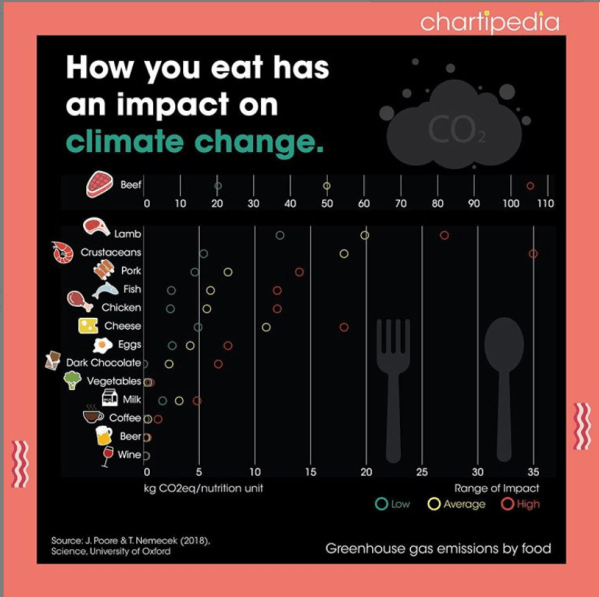
Environmental impact of consumption of different foods.
The trend in power plants installed capacity in India using an animated line chart in R using ggplot2 package.

This posts discusses the limitations of the chart from Ministry of Power website and how it could be improved.
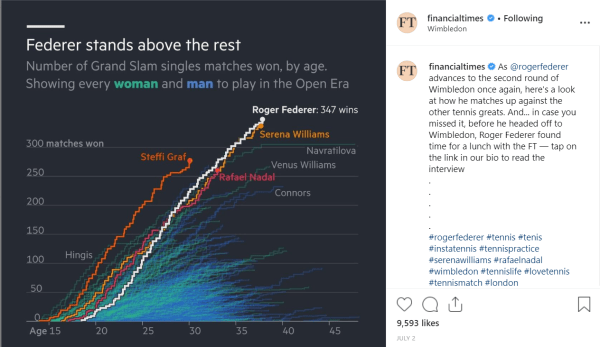
A simple step plot showing the number of Grand Slam singles matches won by age.

The post shows the search of the word "Super Over" in google trend.
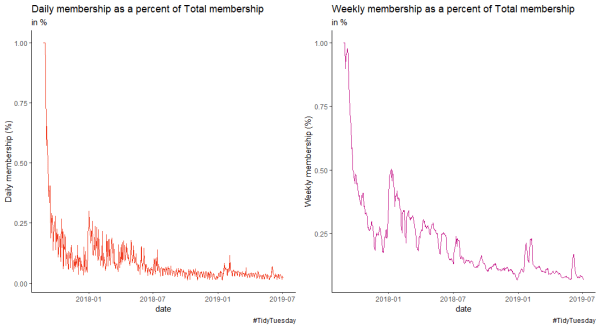
Using R4DS membership data to create line plots in R.
