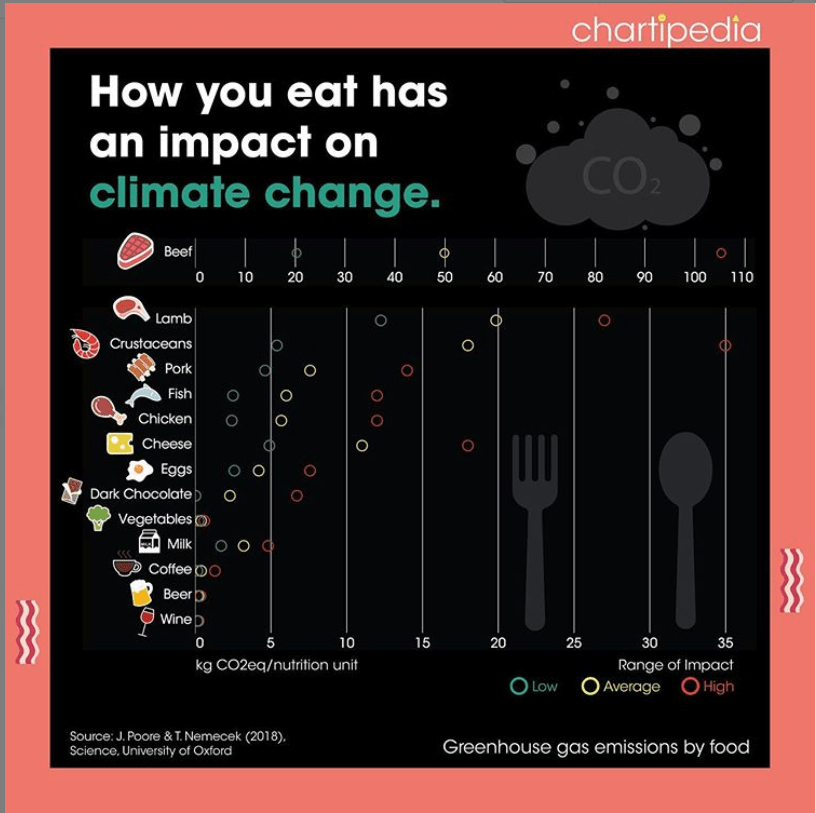
The visual posted on instagram account chartipedia by Poore & Nemecek shows the environmental impact of each type of consumption. Not to my surprise the highest range of environmental impact is from Beef.
It would be interesting to generate a similar plot in R. If you happen to generate something similar share the same by commenting on this post.

Leave a Reply